
Mutoro Group Partners, LP
“Mediocre people don’t like high achievers, and high achievers don’t like mediocre people. So, if everybody doesn’t buy into the same principles and values of the organization at the same high standard, you’re never going to be successful. Just like our spring practice right now. You know what my goal with spring practice is? Get the right guys on the bus. Get them in the right seats. And get the wrong guys off the bus.” – Nick Saban
“They're a rotten crowd,” I shouted across the lawn. “You're worth the whole damn bunch put together.” – Nick Carraway
As of September 30, 2021. Inception of fund investment activity is January 1, 2015.
Dear Partner,
For the first nine months of 2021, the fund returned 10.9% on a gross basis. Net of fees and expenses, it returned 7.7%. While we started the year with 14 portfolio holdings, we ended the third quarter with 12. In the first three quarters of the year, we sold off stakes in three companies. We acquired one new holding. While my second quarter letter focused on our cash management philosophy, this letter will focus on portfolio concentration. I want to write about concentration because it is a crucial aspect of our strategy. The fewer holdings a fund has, the more critical that a thoughtful assessment of what it owns becomes, whether in proportion, valuation, or—as the two quotes above allude to—quality and selection.
Let’s start our assessment of our fund’s concentration with a simple exercise. We can look across our holdings at quarter-end and see how they have performed since the beginning of the year. The table presented below depicts this in descending order from our most significant position to our least. It does not include our cash position.

Before we look at individual holdings, let’s make some inferences about the whole group. We can draw these from the manilla section at the bottom of the exhibit.
The median change in share price was +18.8%. It represents the midpoint number at which half the changes are above, and half are below. The simple average for the group wasn’t too far off: +21.5%. So, from this aggregate perspective, it seems the share price of our “typical” holding rose a lot this year. Seven of our 12 holdings rose far above our total gross portfolio change of +10.9%. If this is true, how come our overall portfolio didn’t grow as much as our typical holding? It comes down to concentration, particularly the proportions of what we own.
To understand this, let’s turn from share price changes to position sizes. Excluding cash, the median allocation of a holding in the third quarter was 3.6%. The simple average was 6.6%. While 3.6% and 6.6% represent our “typical” position size, they don’t tell the whole story. Our position sizes varied greatly. Our top three positions alone represent 52.4% of our assets. That’s meaningful concentration.
Let’s look at the individual asset level to appreciate better this variance and concentration and how it affected overall performance. The most remarkable price change so far this year at an individual security level was +57.1%. But ironically, that was our smallest holding. It represented 1.1% of our assets. At the opposite end of the size spectrum, our largest holding was 25.7% of our assets. This year so far, it had our third smallest change in price at +3.8%. In rising much less than our “typical” holding, it restrained the market value of our portfolio. Some questions may arise: Does this mean I erred in allocation? Should I have reduced the size of our largest holding and instead put a quarter of the fund into what is currently our smallest holding?
Both are reasonable questions. But it’s likely we can approach this from a better angle. Even if hindsight were 20/20 (and we weren’t concerned about the tax implications that result from high portfolio churn), I don’t think that would be the profitable way for us to think about this. We don’t invest for near-term, single-year pricing action. We invest when we think that over the long-term a business has a compelling, differentiated, and defensible competitive market position and is being priced at a discount to its prospects. For this reason, the growth that matters to us is less about the price change year-to-date and more about underlying business performance. A glance at our portfolio from this view suggests why.
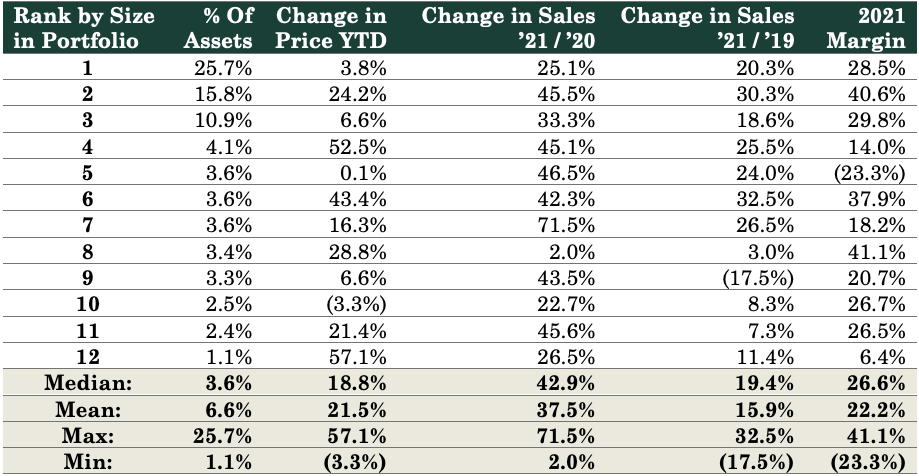
To understand better, let’s expand this exercise. The below table builds on the last exhibit. It again ranks our 12 non-cash holdings by their size as a percentage of our assets. The first three columns are the same as the first exhibit. While the first exhibit focused on concentration and the stock price change year-to-date, the three new columns to the right represent a simplified view of the business story.
If you’re confused by the above numbers or tired after a long day, I understand; after glancing at the table, your face might resemble that new spiral-eyes emoji. 😵💫. So, let’s unpack this.
We’ll explore the new columns one at a time. The fourth column, i.e., Change in Sales ’21 / ’20, shows how the total revenue at each business changed in their 2021 fiscal year-to-date versus the same period in 2020. It is unlikely to surprise anyone that this is an overwhelmingly positive trend. While the pandemic isn’t over globally, most businesses are doing better coming out of the most intense parts of the health crises and lockdowns of 2020. The fifth column, i.e., Change in Sales ’21 / ’19, shows how our holdings’ 2021 revenue year-to-date compares to the same period in 2019. (This represents a compound annual growth rate, or CAGR. Instead of just dividing two numbers 2019 into 2021, it solves for equal growth in the two years between 2019 and 2021. It essentially smooths out year-to-year fluctuations to allow easier comparisons.) The last column shows our holdings’ 2021 year-to-date operating margins, i.e., how much they earn from their business operations divided by their revenue. It’s a useful proxy for the profitability of a company and, in turn, its ability to generate cash. (Other important quantitative considerations affect profitability that we don’t weigh in this exercise, including how much financial leverage a company has, the cost and term of its debt, how much sales it generates given its asset base, etc.)
A few insights emerge. Looking at our aggregate statistics, the median change in revenue of our holdings over the last year was an outstanding 42.9%. Over the last two years, the median change was an impressive 19.4% per year. Margins also looked strong. Our median margin in 2021 was 26.6%. This means that for every dollar of revenue, our “typical” holding made nearly 27 cents of profit before taxes. 😎.
Now let’s move from aggregate portfolio level statistics to the individual company level. Earlier we compared our largest holding (which was 25.7% of our assets) to our smallest holding (which was 1.1% of our assets). We then asked whether we should’ve reversed sizing of the two given how our smallest holding had our biggest price change this year and our largest holding had the third smallest. That was based on looking at stock price changes. Looking at this simplified business story suggests something else. Both revenue growth and margins suggest that while the share price change of our smallest holding was remarkable, its revenue growth and margin weren’t nearly so superlative. While it seems worthwhile for us continuing to own (even in greater proportions), I believe our largest holding is worth owning a lot more of, but because of its business performance not its pricing action.
Now you might be wondering: If these expanded metrics matter, how come we don’t own more of the second-largest holding than the first? It seems to have better metrics across the board. Well, if we only made investments off quantitative measures, that could make sense. But we don’t do that. Behind each of these companies are essential real-world considerations not captured absolutely by numbers, especially historical numbers. To name a few: competitive positioning, product, operations, brand, management competence and integrity, employee satisfaction, etc., all of which bring abundant qualitative differences.
Moreover, a big part of why we own different companies in various sizes is the history of when we bought them, the price-to-value ratio at the time we purchased, and how they’ve fluctuated since in market price. To this end, I would be happy to see our smallest holding become our largest someday. But I’m not currently worried about our largest holding, the strongest player in a rapidly growing market, being such a major part of our portfolio, even though its fluctuations have more import to our prospects than any other. It reminds me of something Warren Buffett wrote in his 1996 annual letter to Berkshire Hathaway shareholders:
To suggest that this investor should sell off portions of his most successful investments simply because they have come to dominate his portfolio is akin to suggesting that the Bulls trade Michael Jordan because he has become so important to the team.
I’ve witnessed many organizations and individuals make the above mistake in my career. We don’t have to follow their lead. (The best path forward doesn’t have to involve choosing between binary options. There’s a world in which we maintain our largest positions while using cash to add more to the smaller positions. Which is what I intend to do. I would rather us have larger holdings of our smallest positions than to have more small positions.)
The exhibit below shows the overall composition of our portfolio at the end of the quarter:
Portfolio Holdings
While the number of holdings we have declined, cash as a percentage of our portfolio has grown. From 6.4% at the start of the year, it reached 12.8% at the end of Q1. It then grew to 16.6% at the end of Q2 before climbing to 20.3% by the end of Q3.
As equity markets rise to new heights, our cash balance tends to rise too. As markets fall, our cash balance tends to fall. This isn’t because we’re attempting to time the major fluctuations in the market. It also isn’t because we’re indifferent to inflation and the public debate about whether it is transient or persistent. It is simply because we try to be disciplined about the prices that we pay for businesses. How come? Because we want to reduce our odds of overpaying and increase our odds of getting more than we paid for, i.e., investing well. The consequence of this discipline is we typically do not buy as much when securities are pricier. This stance tends to increase our odds of protecting against the downside and having greater upside.
Thank you for your continued partnership. Please let me know if you have any questions or comments.
Sincerely,
Godfrey M. Bakuli
Managing Partner